
Beyond the property price: discover the truth about the neighborhood
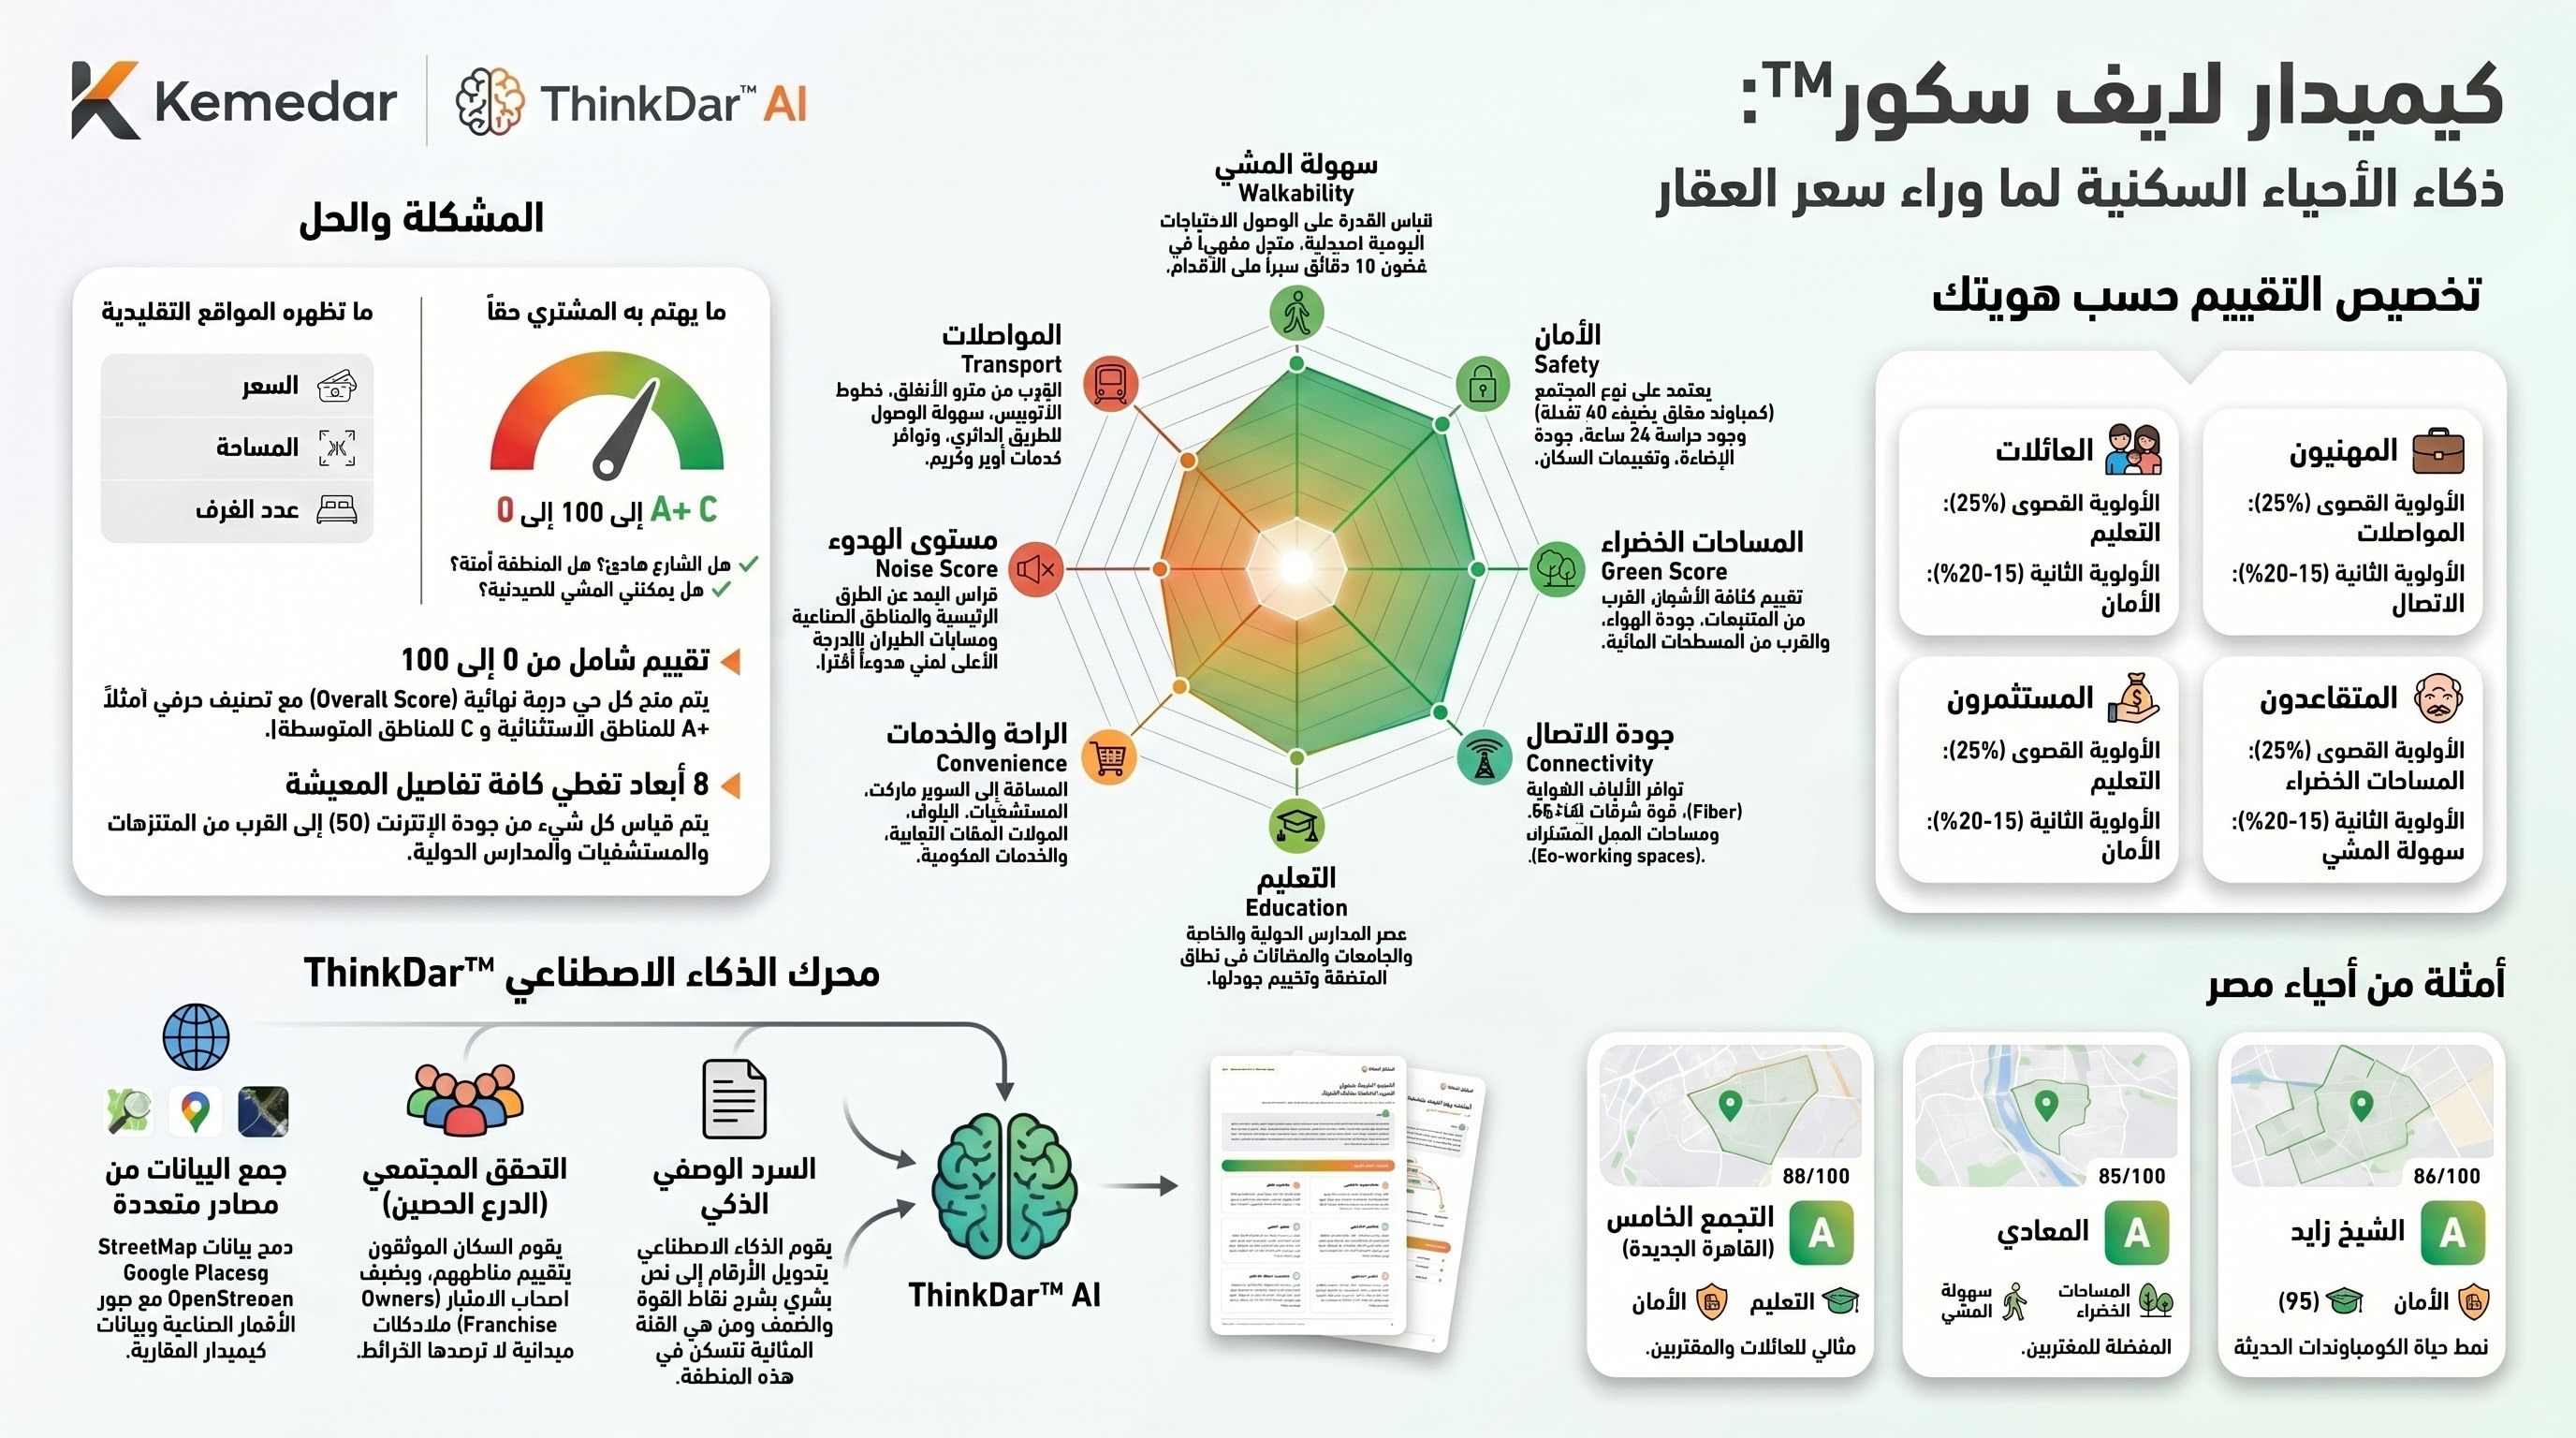
A 0–100 view across eight dimensions that shape daily life, using published and verified data when available—not marketing impressions.
Personalize the model for your priorities
The interactive model below is illustrative. Published neighborhood scores come only from the live Life Score platform.
The problem and the solution
What traditional property sites show
PriceAreaBedroomsWhat buyers actually care about
✓ Is the street quiet and safe?
✓ Can I walk to a pharmacy or school?
✓ How does the area compare with nearby neighborhoods?
Eight dimensions covering the details of daily life
Each dimension is measured and compared when data is available to give a clearer picture of everyday living.
Walkability
Measures access to everyday needs within a ten-minute walk.
Safety
Community type, security, lighting quality and resident feedback.
Green space
Nearby tree cover, air quality and proximity to water.
Connectivity
Fiber availability, mobile coverage and coworking access.
Education
Proximity to schools and universities and the range of education choices.
Convenience
Distance to supermarkets, hospitals and everyday essentials.
Quietness
Measures distance from major roads, industrial areas and noise sources.
Transport
Access to public transport and major road connections.
Personalize the score for who you are
The same neighborhood can mean different things—the illustrative model reweights what matters to you.
Families
Schools and safety lead for a stable environment for children.
Primary priority25%EducationSecondary priority17.5%SafetyProfessionals
Daily mobility and strong connectivity for remote work.
Primary priority25%TransportSecondary priority17.5%ConnectivityInvestors
Livability signals that support long-term neighborhood appeal.
Primary priority25%Green spaceSecondary priority17.5%SafetyRetirees
A calm, walkable neighborhood with less dependence on a car.
Primary priority25%WalkabilitySecondary priority17.5%QuietnessThe ThinkDar™ AI engine
Multiple data sources meet in one engine to produce a clear, understandable report.
Multiple data sources
Area, map and other available data held by the Kemedar platform.
Community verification
Verified resident reviews add local context when available.
Intelligent narrative
Turns data into a readable explanation of strengths and challenges.
Life Score report
Overall score, dimension breakdown and an area summary.
Live examples from Kemedar
These results come from the current Life Score API and are not hard-coded into this design page.
Loading published scores…
Visual resources
The document and infographic supplied with the original design package.
Life Score video
A visual guide to using Life Score when comparing neighborhoods.
Discover the Life Score of your next neighborhood
Compare published neighborhoods and make your decision using the available data.
Start exploringLife Score is an informational comparison tool, not a guarantee of neighborhood quality or investment advice.